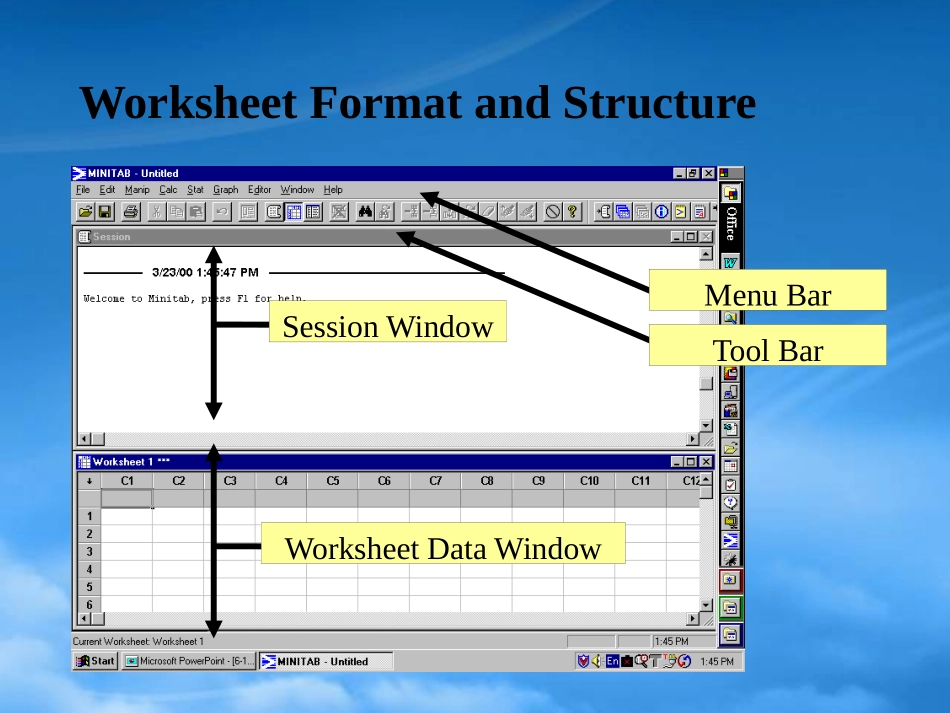
分享
QSM754MINITABPOWERPOINTSLIDESV8(英文PPT133页.pptx
下载文档

ID:48893

大小:2.40MB

页数:135页

格式:PPTX

时间:2023-02-06

收藏 分享赚钱
温馨提示:
1. 部分包含数学公式或PPT动画的文件,查看预览时可能会显示错乱或异常,文件下载后无此问题,请放心下载。
2. 本文档由用户上传,版权归属用户,汇文网负责整理代发布。如果您对本文档版权有争议请及时联系客服。
3. 下载前请仔细阅读文档内容,确认文档内容符合您的需求后进行下载,若出现内容与标题不符可向本站投诉处理。
4. 下载文档时可能由于网络波动等原因无法下载或下载错误,付费完成后未能成功下载的用户请联系客服处理。
网站客服:3074922707
QSM754MINITABPOWERPOINTSLIDESV8 英文 PPT133
INTRODUCTION TO MINITAB VERSION 13 Worksheet Conventions and Menu Structures Minitab Interoperability Graphic Capabilities Pareto Histogram Box Plot Scatter Plot Statistical Capabilities Capability Analysis Hypothesis Test Contingency Tables ANOVA Design of Experiments(DOE)Minitab Training Agenda Worksheet Format and Structure Session Window Worksheet Data Window Menu Bar Tool Bar Text Column C1-T(Designated by-T)Numeric Column C3(No Additional Designation)Data Window Column Conventions Date Column C2-D(Designated by-D)Column Names(Type,Date,Count&Amount Entered Data for Data Rows 1 through 4 Data Entry Arrow Data Rows Other Data Window Conventions Menu Bar-Menu Conventions Hot Key Available(Ctrl-S)Submenu Available(at the end of selection)Menu Bar-File Menu Key Functions Worksheet File Management Save Print Data Import Menu Bar-Edit Menu Key Functions Worksheet File Edits Select Delete Copy Paste Dynamic Links Menu Bar-Manip Menu Key Functions Data Manipulation Subset/Split Sort Rank Row Data Manipulation Column Data Manipulation Menu Bar-Calc Menu Key Functions Calculation Capabilities Column Calculations Column/Row Statistics Data Standardization Data Extraction Data Generation Menu Bar-Stat Menu Key Functions Advanced Statistical Tools and Graphs Hypothesis Tests Regression Design of Experiments Control Charts Reliability Testing Menu Bar-Graph Menu Key Functions Data Plotting Capabilities Scatter Plot Trend Plot Box Plot Contour/3 D plotting Dot Plots Probability Plots Stem&Leaf Plots Menu Bar-Data Window Editor Menu Key Functions Advanced Edit and Display Options Data Brushing Column Settings Column Insertion/Moves Cell Insertion Worksheet Settings Note:The Editor Selection is Context Sensitive.Menu selections will vary for:Data Window Graph Session Window Depending on which is selected.Menu Bar-Session Window Editor Menu Key Functions Advanced Edit and Display Options Font Connectivity Settings Menu Bar-Graph Window Editor Menu Key Functions Advanced Edit and Display Options Brushing Graph Manipulation Colors Orientation Font Menu Bar-Window Menu Key Functions Advanced Window Display Options Window Management/Display Toolbar Manipulation/Display Menu Bar-Help Menu Key Functions Help and Tutorials Subject Searches Statguide Multiple Tutorials Minitab on the Web MINITAB INTEROPERABILITY Minitab Interoperability Excel Minitab PowerPoint Starting with Excel.Load file“Sample 1”in Excel.Starting with Excel.The data is now loaded into Excel.Starting with Excel.Highlight and Copy the Data.Move to Minitab.Open Minitab and select the column you want to paste the data into.Move to Minitab.Select Paste from the menu and the data will be inserted into the Minitab Worksheet.Use Minitab to do the Analysis.Lets say that we would like to test correlation between the Predicted Workload and the actual workload.Select Stat Regression.Fitted Line Plot.Use Minitab to do the Analysis.Minitab is now asking for us to identify the columns with the appropriate date.Click in the box for“Response(Y):Note that our options now appear in this box.Select“Actual Workload”and hit the select button.This will enter the“Actual Workload”data in the Response(Y)data field.Use Minitab to do the Analysis.Now click in the Predictor(X):box.Then click on“Predicted Workload”and hit the select button This will fill in the“Predictor(X):”data field.Both data fields should now be filled.Select OK.Use Minitab to do the Analysis.Minitab now does the analysis and presents the results.Note that in this case there is a graph and an analysis summary in the Session Window Lets say we want to use both in our PowerPoint presentation.Transferring the Analysis.Lets take care of the graph first.Go to Edit.Copy Graph.Transferring the Analysis.Open PowerPoint and select a blank slide.Go to Edit.Paste Special.Transferring the Analysis.Select“Picture(Enhanced Metafile)This will give you the best graphics with the least amount of trouble.Transferring the Analysis.Our Minitab graph is now pasted into the powerpoint presentation.We can now size and position it accordingly.Transferring the Analysis.Now we can copy the analysis from the Session window.Highlight the text you want to copy.Select Edit.Copy.Transferring the Analysis.Now go back to your powerpoint presentation.Select Edit.Paste.Transferring the Analysis.Well we got our data,but it is a bit large.Reduce the font to 12 and we should be ok.Presenting the results.Now all we need to do is tune the presentation.Here we position the graph and summary and put in the appropriate takeaway.Then we are ready to present.Graphic Capabilities Pareto Chart.Lets generate a Pareto Chart from a set of data.Go to File Open Project.Load the file Pareto.mpj.Now lets generate the Pareto Chart.Pareto Chart.Go to:Stat Quality Tools Pareto Chart.Pareto Chart.Fill out the screen as follows:Our data is already summarized so we will use the Chart Defects table.Labels in“Category”Frequencies in“Quantity”.Add title and hit OK.Pareto Chart.

此文档下载收益归作者所有

下载文档
你可能关注的文档
收起
展开