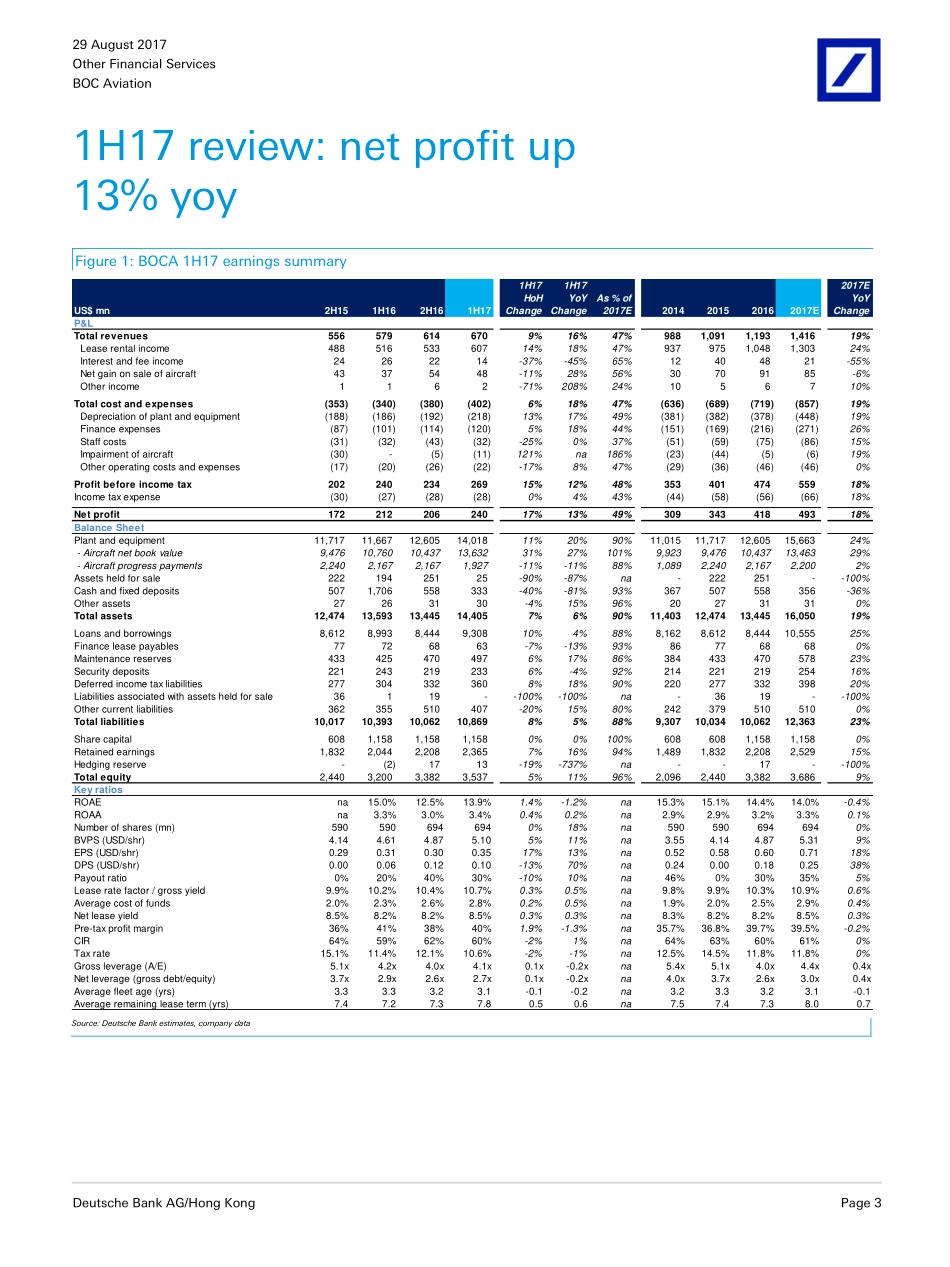
分享
20170829-德意志银行-中银航空租赁-02588.HK-Good quality results with payout ratio guidance lifted; Buy.pdf
下载文档
温馨提示:
1. 部分包含数学公式或PPT动画的文件,查看预览时可能会显示错乱或异常,文件下载后无此问题,请放心下载。
2. 本文档由用户上传,版权归属用户,汇文网负责整理代发布。如果您对本文档版权有争议请及时联系客服。
3. 下载前请仔细阅读文档内容,确认文档内容符合您的需求后进行下载,若出现内容与标题不符可向本站投诉处理。
4. 下载文档时可能由于网络波动等原因无法下载或下载错误,付费完成后未能成功下载的用户请联系客服处理。
网站客服:3074922707
20170829-德意志银行-中银航空租赁-02588.HK-Good quality results with payout ratio guidance lifted; Bu
Deutsche Bank Markets Research Rating Buy Asia Singapore Banking/Finance Other Financial Services Company BOC Aviation Date 29 August 2017 Results Good quality results with payout ratio guidance lifted;Buy Reuters Bloomberg Exchange Ticker 2588.HK 2588 HK HSI 2588 Visible growth,expanding net yield and higher payout ratio;lifting TP to HK$49 _ Deutsche Bank AG/Hong Kong Deutsche Bank does and seeks to do business with companies covered in its research reports.Thus,investors should be aware that the firm may have a conflict of interest that could affect the objectivity of this report.Investors should consider this report as only a single factor in making their investment decision.DISCLOSURES AND ANALYST CERTIFICATIONS ARE LOCATED IN APPENDIX 1.MCI(P)083/04/2017.Price at 29 Aug 2017(HKD)41.00 Price target-12mth(HKD)49.00 52-week range(HKD)43.30-37.50 HANG SENG INDEX 27,863 Jacky Zuo Research Analyst(+852)2203 6255 Hans Fan,CFA Research Analyst(+852)2203 6353 Key changes TP 48.00 to 49.00 2.1%Net profit(FYE)483.0 to 493.4 2.2%Source:Deutsche Bank Price/price relative 3640444852566/1612/166/17BOC AviationHANG SENG INDEX(Rebased)Performance(%)1m 3m 12m Absolute 1.0 3.9 8.9 HANG SENG INDEX 3.3 8.4 22.1 Source:Deutsche Bank BOCA reported 1H17 results with net profit of US$240mn,up 13%yoy/17%hoh and in line with our forecast.Despite lower-than-expected sales gains,the lessor managed to expand net yield to 8.5%in 1H17 from 8.2%in 2016.2H17 will be another busy half year for the company with 41 aircraft deliveries scheduled(vs.37 in 1H17).The company lifted its 1H17 payout ratio to 30%from 20%in 1H16 and revised full year payout guidance from 30%to 35%.We view this as a positive move to improve shareholders return.The stock trades at 1.0 x 2017E P/B with 14-15%ROE and 4-5%yield.Buy with HK$49 TP.Key results highlights in 1H17 Revenue grew by 16%yoy,driven by lease income(+18%yoy)and aircraft sales gains(+28%yoy).It sold 19 aircraft in 1H17 vs.22 in 1H16.Interest and fee income dropped by 45%yoy due to lower pre-delivery payments.Net lease yield expanded to 8.5%from 8.2%in 2016,with faster repricing of asset yield(10.7%vs.10.3%in 2016)than funding cost(2.8%vs.2.5%in 2016).Management sees a stable margin given slower US rate hike expectations.Costs rose 18%yoy with a stable PBT margin(40%vs.41%in 1H16).Staff cost was flat yoy due to a change in long-term incentive plan.From 2017,50%of key managements bonus will be shares,which will be counted in cost from 2Q2018.BOCA owned 261 aircraft as of June 2017,with narrowbody accounting for 64%of net book value.Management guided a 60%/40%or 70%/30%split between narrow/wide body for newly acquired aircraft.For widebody,BOCA seeks long-term leases of 12-15 years and does not take placement risk.The leverage ratio(debt/equity)improved to 2.7x from 2.6x in 2016,with ROE of 13.9%.Management maintained its 3.5x leverage target by end-2018(vs.by 2019 on our forecasts).BOCA charged US$11mn impairment loss in 1H17 related to five E190 and one A330.It intends to sell the E190s in 2H17.Valuation and risks With a better margin outlook,we lift our earnings forecasts by 1-2%in 2017E-18E and revise up our TP by 2%to HK$49.We derive our TP using a three-stage GGM valuation model.Key downside risks:lower-than-expected growth,intensifying competition,and aircraft oversupply.See pages 5-7 for details.Distributed on:29/08/2017 16:45:44 GMT0bed7b6cf11c29 August 2017 Other Financial Services BOC Aviation Page 2 Deutsche Bank AG/Hong Kong Model updated:29 August 2017 Running the numbers Asia Singapore Other Financial Services BOC AviationBOC Aviation Reuters:2588.HK Bloomberg:2588 HK BuyBuy Price(29 Aug 17)HKD 41.00 Target Price HKD 49.00 52 Week range HKD 37.50-43.30 Market Cap(m)HKDm 28,454 USDm 3,637 Company Profile BOC Aviation is a leading global aircraft lessor headquartered in Singapore founded in 1993,and the company ranked No.1 in Asia and No.5 globally in terms of value of owned aircraft in 2015.The company(originally called Singapore Aircraft Leasing Enterprise)was 100%acquired by Bank of China(BOC)in December 2006,and went publicly listed in Hong Kong in June 2016.BOC remains the controlling shareholder of the company with 70%stake.BOC Aviation mainly acquires aircraft from OEMs and places aircraft on long-term operating lease contracts.Jacky Zuo +852 2203 6255 Fiscal year end 31-Dec 20142014 20152015 20162016 2017E2017E 2018E2018E 2019E2019E Data Per Share EPS(stated)(USD)0.52 0.58 0.65 0.71 0.82 0.95 EPS FD(stated)(USD)0.52 0.58 0.65 0.71 0.82 0.95 EPS FD(DB adj.)(USD)0.52 0.58 0.65 0.71 0.82 0.95 Growth rate-EPS(stated)(%)11.37 11.26 11.91 9.17 14.64 16.90 DPS(USD)0.24 0.00 0.18 0.25 0.29 0.33 BVPS(stated)(USD)3.55 4.14 4.87 5.31 5.84 6.46 BVPS(DB adj.)(USD)3.55 4.14 4.87 5.31 5.84 6.46 Average market cap 0 0 3,539 3,637 3,637 3,637 Shares in Issue(m)590 590 694 694 694 694 Valuation Ratios&Profitability Measures P/E(stated)na na 7.8 7.4 6.4 5.5 P/E FD(stated)na na 7.8 7.4 6.4 5.5 P/E FD(DB adj.)na na 7.8 7.4 6.4 5.5 P/B(stated)na na 1.0 1.0 0.9 0.8 P/B(DB adj.)na na 1.0 1.0 0.9 0.8 ROE(stated.)(%)15.3 15.1 14.4 14.0 14.6 15.5 ROA(adj.)(%)2.9 2.9 3.2 3.3 3.2 3.2 Dividend yield(%)na na 3.5 4.7 5.4 6.4 Dividend cover(x)2.2 nm 3.6 2.9 2.9 2.9 Payout ratio(%)45.9 0.0 29.9 35.0 35.0 35.0 Profit&Loss(USDm)Net interest revenue 786 807 833 1,032 1,232 1,459 Non interest income 52 115 145 113 114 115 Fees&Commissions 12 40 48 21 19 19 Trading Revenue 0 0 0 0 0 0 Insurance revenue 0 0 0 0 0 0 Dividend income 0 0 0 0 0 0 Other revenue 40 75 97 92 95 95 Total revenue 838 922 977 1,145 1,346 1,574 Total operating costs 462 477 499 580 698 816 Pre-provision profit/(loss)376 445 479 565 648 758 Bad debt expense 23 44 5 6 7 8 Operating Profit 353 401 474 559 641 749 Goodwill 0 0 0 0 0 0 Pre-tax associates 0 0 0 0 0 0 Extraordinary&Other Items 0 0 0 0 0 0 Pre-tax profit 353 401 474 559 641 749 Tax 44 58 56 66 75 88 Minorities 0 0 0 0 0 0 Preference dividends 0 0 0 0 0 0 Stated net profit 309 343 418 493 566 661 DB adj.core earnings 309 343 418 493 566 661 Key Balance Sheet Items(USDm)&Capital Ratios Risk-weighted assets 0 0 0 0 0 0 Interest-earning assets 9,923 9,476 10,437 13,463 16,132 18,858 Total loans na na na na na na Total deposits 0 0 0 0 0 0 Stated shareholders equity 2,096 2,440 3,382 3,686 4,054 4,484 Preference share capital na na na na na na Tier 1 capital 0 0 0 0 0 0 Tier 1 ratio(%)0 0 0 0 0 0 Tangible equity/total assets(%)18 20 25 23 21 20 Credit Quality Gross NPLs/Total loans(%)na na na na na na Provisions/NPLs(%)nm nm nm nm nm nm Bad debt exp/Avg loans(%)Growth Rates&Key Ratios Growth in net interest income(%)17.6 2.6 3.2 23.9 19.4 18.4 Growth in fee income(%)-58.5 243.3 19.7-55.0-10.0 0.0 Growth in non-interest income(%)-55.0 123.7 25.5-21.6 0.4 0.6 Growth in revenues(%)7.0 10.1 6.0 17.2 17.6 16.9 Growth in costs(%)7.6 3.2 4.6 16.3 20.3 16.9 Pre-provision earnings growth(%)6.3 18.5 7.5 18.0 14.7 16.9 Growth in bad debts(%)-46.0 90.0-89.1 18.5 23.2 18.4 Growth in RWA(%)nm nm nm nm nm nm Growth in loans(%)na na na na na na Growth in deposits(%)nm nm nm nm nm nm Loan-to-deposits ratio(%)nm nm nm nm nm nm Net int.margin(%)8.3 8.3 8.4 8.6 8.3 8.3 Cost income ratio(%)55.1 51.7 51.0 50.7 51.9 51.8 Cost asset ratio(%)4.3 4.0 3.8 3.9 4.0 4.0 Trading income/Total Rev(%)0.0 0.0 0.0 0.0 0.0 0.0 Source:Company data,Deutsche Bank estimates 29 August 2017 Other Financial Services BOC Aviation Deutsche Bank AG/Hong Kong Page 3 1H17 review:net profit up 13%yoy Figure 1:BOCA 1H17 earnings summary US$mn2H151H162H161H171H17 HoH Change1H17 YoY ChangeAs%of 2017E2014201520162017E2017E YoY ChangeP&LTotal revenues556 579 614 670 9%16%47%988 1,091 1,193 1,416 19%Lease rental income488 516 533 607 14%18%47%937 975 1,048 1,303 24%Interest and fee income24 26 22 14 -37%-45%65%12 40 48 21 -55%Net gain on sale of aircraft43 37 54 48 -11%28%56%30 70 91 85 -6%Other income1 1 6 2 -71%208%24%10 5 6 7 10%Total cost and expenses(353)(340)(380)(402)6%18%47%(636)(689)(719)(857)19%Depreciation of plant and equipment(188)(186)(192)(218)13%17%49%(381)(382)(378)(448)19%Finance expenses(87)(101)(114)(120)5%18%44%(151)(169)(216)(271)26%Staff costs(31)(32)(43)(32)-25%0%37%(51)(59)(75)(86)15%Impairment of aircraft(30)-(5)(11)121%na186%(23)(44)(5)(6)19%Other operating costs and expenses(17)(20)(26)(22)-17%8%47%(29)(36)(46)(46)0%Profit before income tax202 240 234 269 15%12%48%353 401 474 559 18%Income tax expense(30)(27)(28)(28)0%4%43%(44)(58)(56)(66)18%Net profit172 212 206 240 17%13%49%309 343 418 493 18%Balance SheetPlant and equipment11,717 11,667 12,605 14,018 11%20%90%11,015 11,717 12,605 15,663 24%-Aircraft net book value9,476 10,760 10,437 13,632 31%27%101%9,923 9,476 10,437 13,463 29%-Aircraft progress payments2,240 2,167 2,167 1,927 -11%-11%88%1,089 2,240 2,167 2,200 2%Assets held for sale222 194 251 25 -90%-87%na-222 251 -100%Cash and fixed deposits507 1,706 558 333 -40%-81%93%367 507 558 356 -36%Other assets27 26 31 30 -4%15%96%20 27 31 31 0%Total assets12,474 13,593 13,445 14,405 7%6%90%11,403 12,474 13,445 16,050 19%Loans and borrowings8,612 8,993 8,444 9,308 10%4%88%8,162 8,612 8,444 10,555 25%Finance lease payables77 72 68 63 -7%-13%93%86 77 68 68 0%Maintenance reserves433 425 470 497 6%17%86%384 433 470 578 23%Security deposits221 243 219 233 6%-4%92%214 221 219 254 16%Deferred income tax liabilities277 304 332 360 8%18%90%220 277 332 398 20%Liabilities associated with assets held for sale36 1 19 -100%-100%na-36 19 -100%Other current liabilities362 355 510 407 -20%15%80%242 379 510 510 0%Total liabilities10,017 10,393 10,062 10,869 8%5%88%9,307 10,034 10,062 12,363 23%Share capital608 1,158 1,158 1,158 0%0%100%608 608 1,158 1,158 0%Retained earnings1,832 2,044 2,208 2,365 7%16%94%1,489 1,832 2,208 2,529 15%Hedging reserve-(2)17 13 -19%-737%na-17 -100%Total equity2,440 3,200 3,382 3,537 5%11%96%2,096 2,440 3,382 3,686 9%Key ratiosROAEna15.0%12.5%13.9%1.4%-1.2%na15.3%15.1%14.4%14.0%-0.4%ROAAna3.3%3.0%3.4%0.4%0.2%na2.9%2.9%3.2%3.3%0.1%Number of shares(mn)5905906946940%18%na5905906946940%BVPS(USD/shr)4.144.614.875.105%11%na3.554.144.875.319%EPS(USD/shr)0.290.310.300.3517%13%na0.520.580.600.7118%DPS(USD/shr)0.000.060.120.10-13%70%na0.240.000.180.2538%Payout ratio0%20%40%30%-10%10%na46%0%30%35%5%Lease rate factor/gross yield9.9%10.2%10.4%10.7%0.3%0.5%na9.8%9.9%10.3%10.9%0.6%Average cost of funds2.0%2.3%2.6%2.8%0.2%0.5%na1.9%2.0%2.5%2.9%0.4%Net lease yield8.5%8.2%8.2%8.5%0.3%0.3%na8.3%8.2%8.2%8.5%0.3%Pre-tax profit margin36%41%38%40%1.9%-1.3%na35.7%36.8%39.7%39.5%-0.2%CIR64%59%62%60%-2%1%na64%63%60%61%0%Tax rate15.1%11.4%12.1%10.6%-2%-1%na12.5%14.5%11.8%11.8%0%Gross leverage(A/E)5.1x4.2x4.0 x4.1x0.1x-0.2xna5.4x5.1x4.0 x4.4x0.4xNet leverage(gross debt/equity)3.7x2.9x2.6x2.7x0.1x-0.2xna4.0 x3.7x2.6x3.0 x0.4xAverage fleet age(yrs)3.33.33.23.1-0.1-0.2na3.23.33.23.1-0.1Average remaining lease term(yrs)7.47.27.37.80.50.6na7.57.47.38.00.7 Source:Deutsche Bank estimates,company data 29 August 2017 Other Financial Services BOC Aviation Page 4 Deutsche Bank AG/Hong Kong BOCA took 34 new deliveries and sold 19 aircraft in 1H17 Figure 2:BOCA quarterly operational data BOCA Quarterly Operational Data1Q162Q163Q164Q161Q172Q17Aircraft owned230226231246257261-net increase3-4515114Aircraft managed413938383636Total fleet number(owned+managed)271265269284293297Avg aircraft age(yr)3.23.33.43.23.23.1Avg remaining lease term(yr)7.37.26.97.37.47.8Order book 232218215199201196Aircraft deliveried131413271918-added onto own fleet101111241717-acquired by customers332321Aircraft sold in the quarter71569613No.of lease signed in the quarter32928103122Aircraft utilization rate100.0%100.0%100.0%100.0%99.3%99.9%No.of airline customer626467687375No.of operating countries313131323434Placement progress for aircraft on order100%for FY16;over 50%for FY17100%for FY16;over 60%for FY17100%for FY16;over 90%for FY1775%for 201792%for 2017(77 to be delivered)95%for 2017(80 to be delivered)Net aircraft book value breakdown by region income breakdownincome breakdownincome breakdown income breakdown-2016Asia Pacific(ex China)35.5%35.0%34.5%33.7%28.3%25.9%China(incl.HK,Macau and Taiwan)19.3%19.8%20.0%21.0%30.0%30.7%Americas17.1%16.9%17.0%17.1%14.2%13.9%Europe21.7%21.8%22.1%22.0%23.0%25.3%Middle East&Africa6.5%6.5%6.5%6.2%4.5%4.2%Total100.1%100.0%100.1%100.0%100.0%100.0%Number of Owned Aircraft BreakdownAirbus A320CEO family109111114122128126Airbus A320NEO family000001Airbus A330CEO family11119111112Airbus A330NEO family000000Airbus A350-900000000Boeing 737NG family817681838991Boeing 737 MAX000000Boeing 777-300ER131313161721Boeing 777-300000000Boeing 787221111Embraer E190 family1111111175Freighters322244Total230226231246257261Narrowbody%87%88%89%88%87%85%A320/B737%83%83%84%83%84%84%Number of Aircraft on Order BreakdownAirbus A320CEO family514038272217Airbus A320NEO family646464646365Airbus A330CEO family224221Airbus A330NEO family000002Airbus A350-900000666Boeing 737NG family524943373327Boeing 737 MAX616161617474Boeing 777-300ER225210Boeing 777-300000000Boeing 787000004Embraer E190 family000000Freighters000000Total232218215199201196Narrowbody%98%98%96%95%96%93%Source:Deutsche Bank,company data 29 August 2017 Other Financial Services BOC Aviation Deutsche Bank AG/Hong Kong Page 5 Lifting 2017E-18E earnings by 1-2%due to better margin outlook Figure 3:Earnings revisions table-BOCA US$mnUS$mn2017E2017E2018E2018E2019E2019E2017E2017E2018E2018E2019E2019E2017E2017E2018E2018E2019E2019E2017E2017E2018E2018E2019E2019ETotal revenuesTotal revenues1,4041,404 1,6991,699 2,0542,054 1,4161,416 1,7421,742 2,0922,092 1%1%2%2%2%2%19%19%23%23%20%20%Lease rental income1,244 1,544 1,893 1,303 1,628 1,977 5%5%4%24%25%21%Interest and fee income52 58 62 21 19 19 -59%-67%-69%-55%-10%0%Net gain on sale of aircraft101 90 90 85 87 87 -16%-3%-3%-6%2%0%Other income7 7 8 7 7 8 0%0%0%10%10%10%Total cost and expensesTotal cost and expenses(856)(856)(1,067)(1,067)(1,318)(1,318)(857)(857)(1,101)(1,101)(1,342)(1,342)0%0%3%3%2%2%19%19%28%28%22%22%Depreciation of plant and equipment(432)(514)(604)(448)(552)(654)4%7%8%19%23%18%Finance expenses(287)(402)(547)(271)(396)(518)-6%-2%-5%26%46%31%Staff costs(86)(97)(110)(86)(99)(113)0%2%4%15%15%15%Other operating costs and expenses(46)(47)(49)(46)(47)(49)0%0%0%0%2%3%Profit before income taxProfit before income tax547547 632632 736736 559559 641641 749749 2%2%1%1%2%2%18%18%15%15%17%17%Income tax expense(64)(74)(87)(66)(75)(88)2%1%2%18%15%17%Net profitNet profit483483 558558 649649 493493 566566 661661 2%2%1%1%2%2%18%18%15%15%17%17%Changes(%)Changes(%)NewNewyoy growth(%)yoy growth(%)PreviousPrevious Source:Deutsche Bank estimates,company data Valuation and risks Lifting TP to HK$49 based on 1.19x 2017E P/B We have revised up our target price by 2%to HK$49 following our earnings changes.We derive our target price from 1.19x 2017E P/B,based on a three-stage Gordon Growth Model(GGM).We assume a ROE of 14.7%/13.0%/11.7%for the first/second/terminal stage,with COE of 11.5%.The C

此文档下载收益归作者所有

下载文档
你可能关注的文档
收起
展开