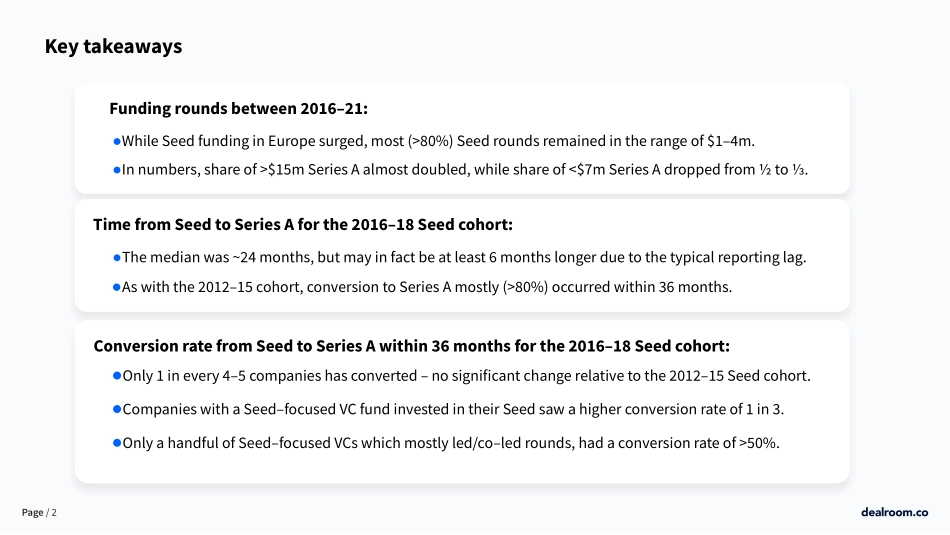
分享
2023年欧洲A轮投资报告(英)-17页-WN9.pdf
下载文档

ID:3614264

大小:2.85MB

页数:19页

格式:PDF

时间:2024-06-26

收藏 分享赚钱
温馨提示:
1. 部分包含数学公式或PPT动画的文件,查看预览时可能会显示错乱或异常,文件下载后无此问题,请放心下载。
2. 本文档由用户上传,版权归属用户,汇文网负责整理代发布。如果您对本文档版权有争议请及时联系客服。
3. 下载前请仔细阅读文档内容,确认文档内容符合您的需求后进行下载,若出现内容与标题不符可向本站投诉处理。
4. 下载文档时可能由于网络波动等原因无法下载或下载错误,付费完成后未能成功下载的用户请联系客服处理。
网站客服:3074922707
2023 欧洲 投资 报告 17 WN9
May 2023The Journey to Series A in Europe Part 3Conversion of 20162018 seed rounds to datein partnership withThe Journey to Series A in Europe Part 3June 2023群内每日免费分享5份+最新资料 群内每日免费分享5份+最新资料 300T网盘资源+4040万份行业报告为您的创业、职场、商业、投资、亲子、网赚、艺术、健身、心理、个人成长 全面赋能!添加微信,备注“入群”立刻免费领取 立刻免费领取 200套知识地图+最新研报收钱文案、增长黑客、产品运营、品牌企划、营销战略、办公软件、会计财务、广告设计、摄影修图、视频剪辑、直播带货、电商运营、投资理财、汽车房产、餐饮烹饪、职场经验、演讲口才、风水命理、心理思维、恋爱情趣、美妆护肤、健身瘦身、格斗搏击、漫画手绘、声乐训练、自媒体打造、效率软件工具、游戏影音扫码先加好友,以备不时之需扫码先加好友,以备不时之需行业报告/思维导图/电子书/资讯情报行业报告/思维导图/电子书/资讯情报致终身学习者社群致终身学习者社群关注公众号获取更多资料关注公众号获取更多资料Page/2 EXTRA CONTENTALIGN HERE EXTRA CONTENT/SOURCES/INSPIRATIONLOGOS SPACINGYEAR/EXTRA LABELTITLEGRAPH TITLEGRAPH/MAIN CONTENTFOOTERGRAPH 1GRAPH 2Startups&venture capitalThis report focuses on companies in the internet age,i.e.after 1990.Most(but not all)unicorns are VC backed.The majority of the companies included in the analysis are techdriven.Companies included in the analysis are techdriven.Industries include software,ecommerce,online marketplaces,hardware,ICT infrastructure.The full industry&business model taxonomy can be found online.Investment numbers refer to venture capital investment rounds such as seed,series A,B,C,late stage,and growth equity rounds.It excludes debt or other nonequity funding,lending capital,grants and ICOs.Buyouts,M&A,secondary rounds,and IPOs are treated as exits:excluded from funding data,but included in exit data.Valuations,unicorns&future unicornsA unicorn is defined as a rapidly scaling company(and tech enabled)that has reached a$1 billion valuation,on the basis of a funding round(unrealised),acquisition or IPO(realised).There are some notable edgecase.A future unicorn is defined as a tech driven company valued at over$250 million but less than$1 billion,excluding acquired and/or public companies.For the analysis of Unicorns and Future Unicorns this reports uses the currency USD instead of EUR.More about the unicorn methodology can be found here.The combined valuation of startups is based on their market cap or latest transaction value in Euro.Transaction value is realised from exit or implied unrealised valuation from the latest VC round,which is either announced or estimated by Dealroom based on marketbased assumptions for dilution.Underlying dataDealrooms proprietary database and software aggregate data from multiple sources:harvesting public information,usersubmitted data verified by Dealroom,data engineering.All data is verified and curated with an extensive manual process.Most underlying data from the report is available online via edtech.dealroom.co.For more info please visit dealroom.co or contact supportdealroom.co.While Seed funding in Europe surged,most(80%)Seed rounds remained in the range of$14m.In numbers,share of$15m Series A almost doubled,while share of 80%)Seed rounds remained in the range of$14m.In numbers,share of$15m Series A almost doubled,while share of 80%)occurred within 36 months.Conversion rate from Seed to Series A within 36 months for the 201618 Seed cohort:Only 1 in every 45 companies has converted no significant change relative to the the 201215 Seed cohort.Companies with a Seedfocused VC fund invested in their Seed saw a higher conversion rate of 1 in 3.Only a handful of Seedfocused VCs which mostly led/coled rounds,had a conversion rate of 50%.The median was 24 months,but may in fact be at least 6 months longer due to the typical reporting lag.As with the 201215 cohort,conversion to Series A mostly(80%)occurred within 36 months.Only 1 in every 45 companies has converted no significant change relative to the 201215 Seed cohort.Companies with a Seedfocused VC fund invested in their Seed saw a higher conversion rate of 1 in 3.Only a handful of Seedfocused VCs which mostly led/coled rounds,had a conversion rate of 50%.Funding rounds between 201621:Time from Seed to Series A for the 201618 Seed cohort:Conversion rate from Seed to Series A within 36 months for the 201618 Seed cohort:Page/3 EXTRA CONTENTALIGN HERE EXTRA CONTENT/SOURCES/INSPIRATIONLOGOS SPACINGYEAR/EXTRA LABELTITLEGRAPH TITLEGRAPH/MAIN CONTENTFOOTERGRAPH 1GRAPH 2Startups&venture capitalThis report focuses on companies in the internet age,i.e.after 1990.Most(but not all)unicorns are VC backed.The majority of the companies included in the analysis are techdriven.Companies included in the analysis are techdriven.Industries include software,ecommerce,online marketplaces,hardware,ICT infrastructure.The full industry&business model taxonomy can be found online.Investment numbers refer to venture capital investment rounds such as seed,series A,B,C,late stage,and growth equity rounds.It excludes debt or other nonequity funding,lending capital,grants and ICOs.Buyouts,M&A,secondary rounds,and IPOs are treated as exits:excluded from funding data,but included in exit data.Valuations,unicorns&future unicornsA unicorn is defined as a rapidly scaling company(and tech enabled)that has reached a$1 billion valuation,on the basis of a funding round(unrealised),acquisition or IPO(realised).There are some notable edgecase.A future unicorn is defined as a tech driven company valued at over$250 million but less than$1 billion,excluding acquired and/or public companies.For the analysis of Unicorns and Future Unicorns this reports uses the currency USD instead of EUR.More about the unicorn methodology can be found here.The combined valuation of startups is based on their market cap or latest transaction value in Euro.Transaction value is realised from exit or implied unrealised valuation from the latest VC round,which is either announced or estimated by Dealroom based on marketbased assumptions for dilution.Underlying dataDealrooms proprietary database and software aggregate data from multiple sources:harvesting public information,usersubmitted data verified by Dealroom,data engineering.All data is verified and curated with an extensive manual process.Most underlying data from the report is available online via edtech.dealroom.co.For more info please visit dealroom.co or contact supportdealroom.co.Funding rounds are selflabeled with little consistency across different companies and investors.But robust benchmarks on the journey from Seed to Series A require reliable comparisons.So weve applied a systematic approach to relabeling rounds based on amount,timing,sequencing,and more.This generated a qualified dataset of 16,805 relevant funding rounds of 12,957 companies since 2016.Weve assessed developments in the funding environment and in the dynamics of conversion from Seed to Series A during that period,and compared those to the first analysis we published 4 years ago.Where possible,we conducted a sensitivity analysis of the methodology to ascertain the validity of the findings.The full methodology and definitions are detailed at the end of this document.Funding rounds are selflabeled with little consistency across different companies and investors.But robust benchmarks on the journey from Seed to Series A require reliable comparisons.So weve applied a systematic approach to relabeling rounds based on amount,timing,sequencing,and more.This generated a qualified dataset of 16,805 relevant funding rounds of 12,957 companies since 2016.Weve assessed developments in the funding environment and in the dynamics of conversion from Seed to Series A during that period,and compared those to the first analysis we published 4 years ago.Where possible,we conducted a sensitivity analysis of the methodology to ascertain the validity of the findings.The full methodology and definitions are detailed at the end of this document.The rationale for this analysisPage/4 EXTRA CONTENTALIGN HERE EXTRA CONTENT/SOURCES/INSPIRATIONLOGOS SPACINGYEAR/EXTRA LABELTITLEGRAPH TITLEGRAPH/MAIN CONTENTFOOTERGRAPH 1GRAPH 2Seed rounds1st round=$1m selflabeled as Seed,$17m otherwiseSeed funding in Europe more than doubled between 201621Seed rounds by size201620172018201920202021$1,983M$2,213M$3,008M$2,599M$2,959M$5,308M93%93%87%88%86%80%20162017201820192020202111%10%12%15%While the share of larger Seed rounds doubled,the vast majority of Seed and Seed+rounds remained in the range of$14m.View the rounds link to chartsNumber of rounds Amount($M)=$7m350030002500200015001000500Seed+roundsRounds between a Seed and a Series A,larger than the SeedSeed+rounds by size201620172018201920202021$359M$459M$441M$465M$522M$507M20162017201820192020202191%84%95%87%98%13%8%94%Number of rounds Amount($M)=$7m24022016014010060204080120180200Page/5 EXTRA CONTENTALIGN HERE EXTRA CONTENT/SOURCES/INSPIRATIONLOGOS SPACINGYEAR/EXTRA LABELTITLEGRAPH TITLEGRAPH/MAIN CONTENTFOOTERGRAPH 1GRAPH 2Series A rounds1st round=$4m selflabeled as Series A,$4100m otherwiseSeries A rounds by sizeSeries A rounds1st round=$4m selflabeled as Series A,$4100m otherwiseView the rounds add separating commastwo axisall fonts same size between chartscharts can be largerSeries A funding increased by almost 5x with more than double the number of rounds,the share of number of Series A rounds$15m almost doubled*Less than of$47m Series A rounds were not selflabeled as such.Number of rounds$4m7m$715m$15m50m$50m$4m7m$715m$15m50m$50m 201620172018201920202021$3,323M$15,778M49%43%47%45%41%33%20162017201820192020202115%13%15%14%19%24%110010007006000500300100200400800900$4,361M$5,915M$6,635M$6,706M34%42%37%39%38%39%Page/6 LOGOS SPACINGYEAR/EXTRA LABELTITLEGRAPH TITLEGRAPH/MAIN CONTENTFOOTERGRAPH 1GRAPH 2EXTRA CONTENTALIGN HERE EXTRA CONTENT/SOURCES/INSPIRATIONMedian round size in$mSeed is the 1st round=$1m selflabeled as Seed,$17m otherwise;Series A is the 1st round=$4m selflabeled as Series A,$4100m otherwiseThe median Series A grew by 40%,with an expected spike in 2021Median round size($m)Seed Seed+Series A2016201720182019202020217.12.41.71.72.88.01.92.77.67.92.41.81.92.88.42.22.710.0OK for designMedian round size($m)Seed Seed+Series APage/7 LOGOS SPACINGYEAR/EXTRA LABELTITLEGRAPH TITLEGRAPH/MAIN CONTENTFOOTERGRAPH 1GRAPH 2EXTRA CONTENTALIGN HERE EXTRA CONTENT/SOURCES/INSPIRATION2016201720182019202020211.02.03.0CommentMedian preSeries A capital raised by companies($m)$4M$5M$6M$7M(X to Y companies depending on the threshold)Median preSeries A capital raised by companies($m)Threshold for a relabeled Series A:OK for designThe median amount of capital raised preSeries A has remained between$2.53mThreshold for a relabeled Series A*:3.02.01.0201620172018201920202021Median preSeries A capital raised by companies($m)$4M$5M$6M$7M(130 to 170 companies depending on the threshold)*To assess the robustness of the findings,we included where possible a sensitivity analysis to the minimum qualifying amount for relabeling a round as a Series A when it wasnt self-labeled as such.Page/8 EXTRA CONTENTALIGN HERE EXTRA CONTENT/SOURCES/INSPIRATIONLOGOS SPACINGYEAR/EXTRA LABELTITLEGRAPH TITLEGRAPH/MAIN CONTENTFOOTERGRAPH 1GRAPH 220162018 Seed cohort20122015 Seed cohortConsidering the typical lag between the closing and reporting of Seed rounds which is less common with Series A rounds the actual median from Seed to Series A may be at least 6 months longer.As the different curves demonstrate,these figures are not at all sensitive to the threshold for a relabeled Series A.$4M$5M$6M$7M(500 to 630 companies depending on the threshold)The median time from Seed to Series A is 24 months,and conversion to Series A mostly occurs within 36 months$4M$5M$6M$7M(800 to 1000 companies depending on the threshold)Median time from Seed to Series AMedian time from Seed to Series AThreshold for a relabeled Series A*:%of companies that raised their Series A by that time,out of all converted companies*To assess the robustness of the findings,we included where possible a sensitivity analysis to the minimum qualifying amount for relabeling a round as a Series A when it wasnt self-labeled as such.Page/9 LOGOS SPACINGYEAR/EXTRA LABELTITLEGRAPH TITLEGRAPH/MAIN CONTENTFOOTERGRAPH 1GRAPH 2EXTRA CONTENTALIGN HERE EXTRA CONTENT/SOURCES/INSPIRATIONConversion rate from Seed to Series A within 36 months20122015 Seed cohort 20162018 Seed cohortThese conversion rates vary only slightly(around 1 percentage point)from the ones calculated only based on qualified selflabeled Seed and Series A rounds,demonstrating that while the relabeling makes the analysis more robust,it doesnt materially alter its conclusion.Only 1 in every 45 companies converts from Seed to Series A,and despite the funding surge that rate has barely changed between the 201215 and 201618 Seed cohortsThreshold for a relabeled Series A*:26%24%22%21%23%21%20%19%$4m$5m$6m$7m*To assess the robustness of the findings,we included where possible a sensitivity analysis to the minimum qualifying amount for relabeling a round as a Series A when it wasnt self-labeled as such.Page/10 LOGOS SPACINGYEAR/EXTRA LABELTITLEGRAPH TITLEGRAPH/MAIN CONTENTFOOTERGRAPH 1GRAPH 2EXTRA CONTENTALIGN HERE EXTRA CONTENT/SOURCES/INSPIRATIONCompanies that had a Seedfocused VC fund invested in their Seed round saw a higher conversion rate of 1 in 3xx companies xx companies Conversion rate from Seed to Series A within 36 months,201618 Seed cohortSeed rounds with Seedfocused VCs Europe 658 companies$4m$5m$6m$7m34%33%32%31%Threshold for a relabeled Series A*:26%24%22%21%This is based on the set of portfolio companies of 126 Seedfocused VC funds(excluding stateowned):those who at least 70%of their first investments in a company were at PreSeed/Seed/Seed+stage,and made at least 4 Seed/Seed+investments during 201618.Conversion rate from Seed to Series A within 36 months,201618 Seed cohortSeed rounds with Seedfocused VCs Europe658 companies*To assess the robustness of the findings,we included where possible a sensitivity analysis to the minimum qualifying amount for relabeling a round as a Series A when it wasnt self-labeled as such.Page/11 LOGOS SPACINGYEAR/EXTRA LABELTITLEGRAPH TITLEGRAPH/MAIN CONTENTFOOTERGRAPH 1GRAPH 2EXTRA CONTENTALIGN HERE EXTRA CONTENT/SOURCES/INSPIRATIONOK for design10%20%30%$4m$5m$6m$7mThreshold for a relabeled Series A*:Companies that raise more than$4m of preSeries A funding have a higher conversion rate to Series AConversion rate from Seed to Series A within 36 months,201618 Seed cohort$4M PreSeries A capital*To assess the robustness of the findings,we included where possible a sensitivity analysis to the minimum qualifying amount for relabeling a round as a Series A when it wasnt self-labeled as such.Page/12 LOGOS SPACINGYEAR/EXTRA LABELTITLEGRAPH TITLEGRAPH/MAIN CONTENTFOOTERGRAPH 1GRAPH 2EXTRA CONTENTALIGN HERE EXTRA CONTENT/SOURCES/INSPIRATION26%of Seed companies have raised a Series A after 36 months 201215 Seed cohort New Palo Alto only 201618 Seed cohort New Palo Alto only Conversion rate to Series A by time elapsed since Seed roundSeed is the 1st round=$1m selflabeled as Seed,$17m otherwise;Series A is the 1st round=$4m selflabeled as Series A,$4100m otherwise 201215 Seed cohort New Palo Alto only 201618 Seed cohort New Palo Alto only 201215 Seed cohort 201618 Seed cohort New Palo Alto onl

此文档下载收益归作者所有

下载文档
你可能关注的文档
收起
展开