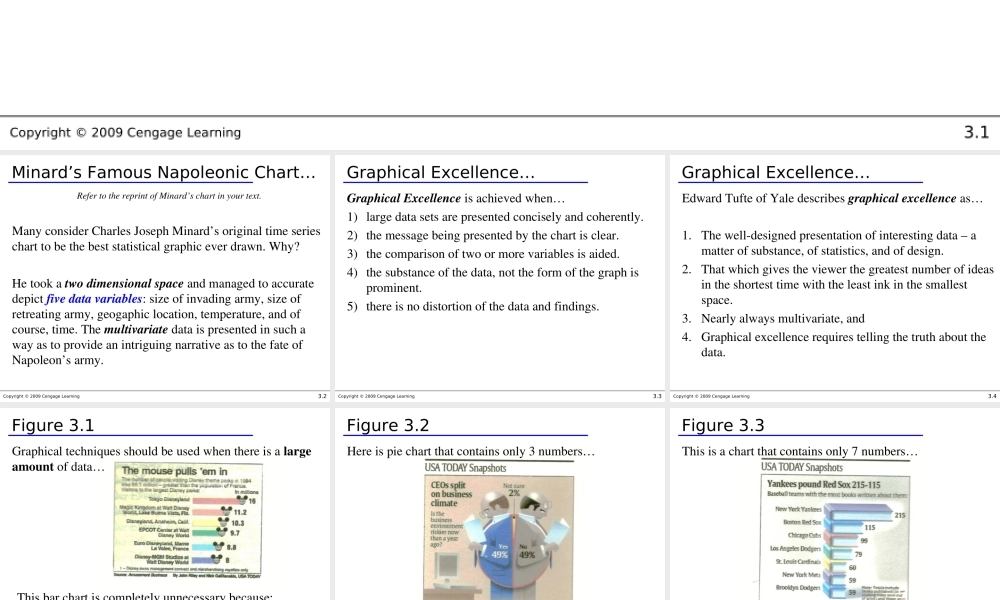
Copyright©2009CengageLearning3.1ChapterThreeArtandScienceofGraphicalPresentationsCopyright©2009CengageLearning3.2Minard’sFamousNapoleonicChart…RefertothereprintofMinard’schartinyourtext.ManyconsiderCharlesJosephMinard’soriginaltimeseriescharttobethebeststatisticalgraphiceverdrawn.Why?Hetookatwodimensionalspaceandmanagedtoaccuratedepictfivedatavariables:sizeofinvadingarmy,sizeofretreatingarmy,geogaphiclocation,temperature,andofcourse,time.ThemultivariatedataispresentedinsuchawayastoprovideanintriguingnarrativeastothefateofNapoleon’sarmy.Copyright©2009CengageLearning3.3GraphicalExcellence…GraphicalExcellenceisachievedwhen…1)largedatasetsarepresentedconciselyandcoherently.2)themessagebeingpresentedbythechartisclear.3)thecomparisonoftwoormorevariablesisaided.4)thesubstanceofthedata,nottheformofthegraphisprominent.5)thereisnodistortionofthedataandfindings.Copyright©2009CengageLearning3.4GraphicalExcellence…EdwardTufteofYaledescribesgraphicalexcellenceas…1.Thewell-designedpresentationofinterestingdata–amatterofsubstance,ofstatistics,andofdesign.2.Thatwhichgivestheviewerthegreatestnumberofideasintheshortesttimewiththeleastinkinthesmallestspace.3.Nearlyalwaysmultivariate,and4.Graphicalexcellencerequirestellingthetruthaboutthedata.Copyright©2009CengageLearning3.5Figure3.1Graphicaltechniquesshouldbeusedwhenthereisalargeamountofdata…Thisbarchartiscompletelyunnecessarybecause:•onlysixnumbersarerepresented.•thereisnoanalysisassociatedwiththedata.Copyright©2009CengageLearning3.6Figure3.2Hereispiechartthatcontainsonly3numbers……itcatchesyoureyebutprovidesnousefulinformationCopyright©2009CengageLearning3.7Figure3.3Thisisachartthatcontainsonly7numbers……hereatablewouldeasilysuffice.Copyright©2009CengageLearning3.8Figure3.4Thisbarchartthatcontainsonly6numbers…Removethenumbersanditsdifficulttounderstandthebarsonthechart.Removethegraph,andthenumbersspeakforthemselves.Copyright©2009CengageLearning3.9GraphicalDeception…Graphicaltechniquescreateavisualimpressi...