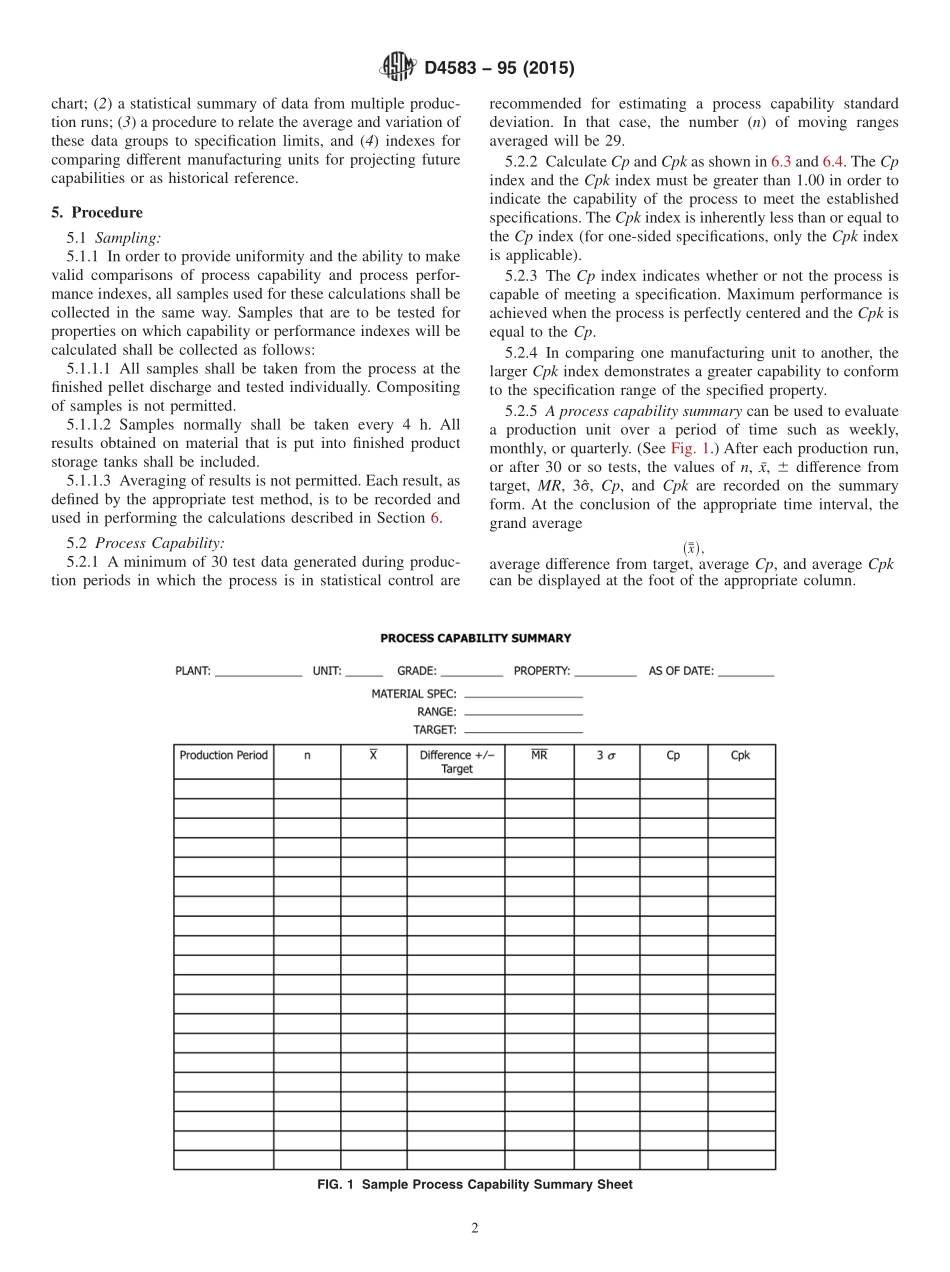
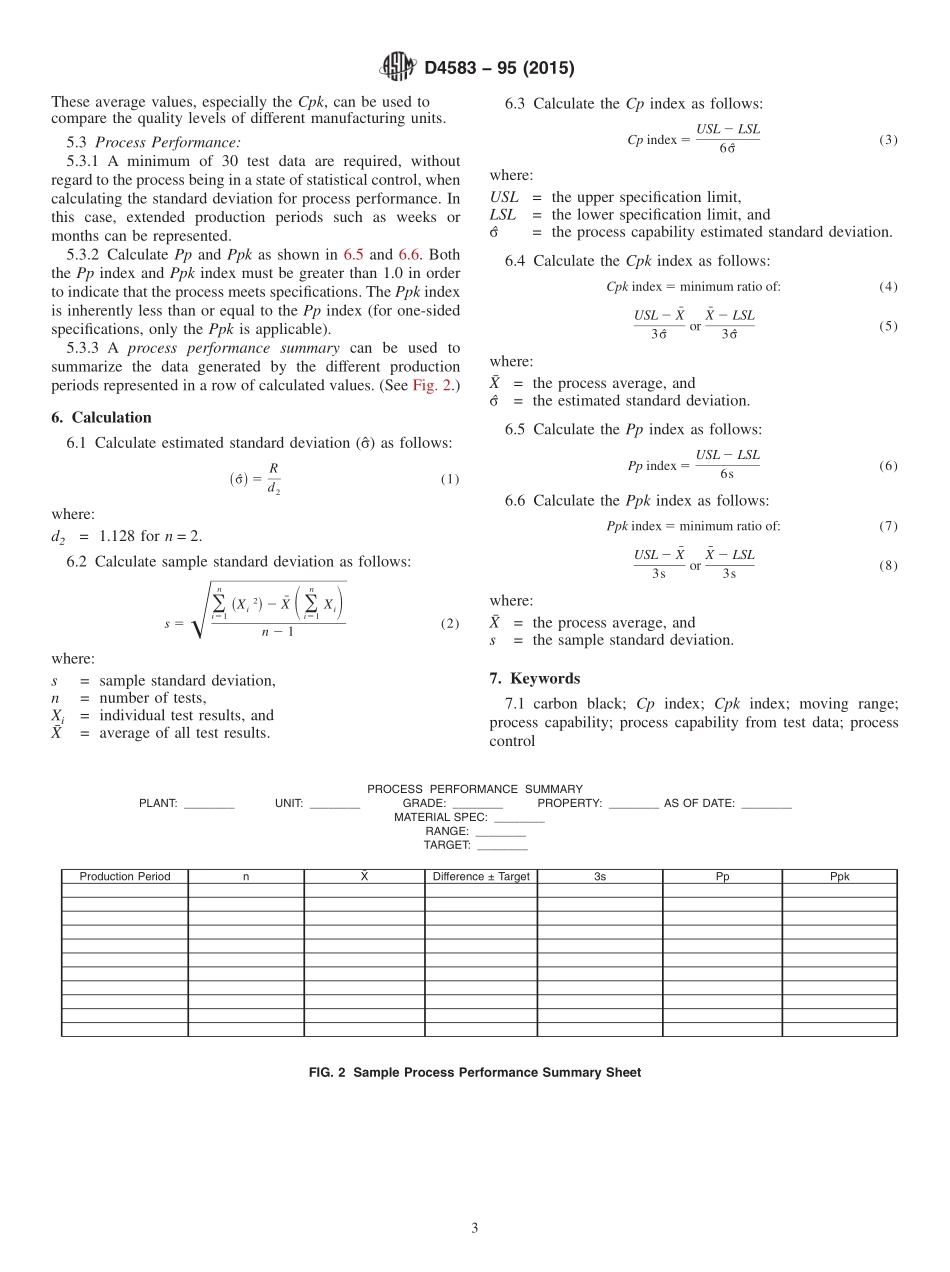
分享
ASTM_D_4583_-_95_2015.pdf
下载文档

ID:176738

大小:88.96KB

页数:4页

格式:PDF

时间:2023-03-04

收藏 分享赚钱
温馨提示:
1. 部分包含数学公式或PPT动画的文件,查看预览时可能会显示错乱或异常,文件下载后无此问题,请放心下载。
2. 本文档由用户上传,版权归属用户,汇文网负责整理代发布。如果您对本文档版权有争议请及时联系客服。
3. 下载前请仔细阅读文档内容,确认文档内容符合您的需求后进行下载,若出现内容与标题不符可向本站投诉处理。
4. 下载文档时可能由于网络波动等原因无法下载或下载错误,付费完成后未能成功下载的用户请联系客服处理。
网站客服:3074922707
TM_D_4583_ _95_2015
Designation:D458395(Reapproved 2015)Standard Practice forCarbon BlackCalculation of Process Indexes From anAnalysis of Process Control Data1This standard is issued under the fixed designation D4583;the number immediately following the designation indicates the year oforiginal adoption or,in the case of revision,the year of last revision.A number in parentheses indicates the year of last reapproval.Asuperscript epsilon()indicates an editorial change since the last revision or reapproval.1.Scope1.1 This practice covers(1)a statistical procedure foranalyzing the test data generated in the statistical processcontrol of a carbon black manufacturing process;(2)a formatfor reporting process capability determined from the analysisof control chart data of an individual production run,and(3)aformat for reporting process performance determined from theanalysis of control chart data of an individual production run.1.2 This practice specifically applies to the analysis ofpelleted carbon black samples taken during the manufacturingprocess prior to storage.This practice does not apply toshipment samples taken from hopper cars or other containers orpackages.1.3 This practice is specifically designed to be used forthose test methods given in Classification D1765 which specifytarget values.However,these techniques are applicable to othertest methods on carbon black.1.4 This practice describes the calculation for two methodsof determining capability factors from an analysis of processcontrol data.1.4.1 Process capability(Cp)is a measurement of variationcalculated from the process control chart data with the use ofan estimated standard deviation()from the mean value of themoving range(R)chart.The calculation of the process capa-bility(Cp and Cpk)indexes can be used as historical informa-tion or to predict future performance of the process,but areonly valid when the process is in a state of statistical control.1.4.2 Process performance(Pp)is a measurement of varia-tion calculated from the process control chart data usingsample standard deviation(s).The calculation of the processperformance(Pp and Ppk)indexes are used for a historicalreference of a process performance and does not require astate of statistical control.2.Referenced Documents2.1 ASTM Standards:2D1765 Classification System for Carbon Blacks Used inRubber Products3.Terminology3.1 Definitions of Terms Specific to This Standard:,43.1.1 average moving rangeR!the arithmetic mean of nmoving ranges,R5(R/n.3.1.2 Cpk indexan index that indicates how well thecommon cause process variability is actually contained withinthe specifications.(See 6.4.)3.1.3 moving range(R)the absolute difference betweenconsecutive,individual test values.3.1.4 Ppk indexindicates how well the common andspecial cause process variability is actually contained withinthe specifications.(See 6.6.)3.1.5 process capability index(Cp)an index that comparesthe magnitude of common cause process variability to therange of upper and lower specification limits(USL and LSL)without regard to where the process is centered;Cp in-dex=(USL LSL)/(6).(See 6.3.)3.1.6 process performance index(Pp)an index that com-pares the magnitude of common and special cause processvariability to the range of the upper and lower specificationlimits(USL and LSL)without regard to where the process iscentered;Pp index=(USL LSL)/(6s).(See 6.5.)4.Significance and Use4.1 This practice will provide the following:(1)a statisticalsummary of individual production run data plotted on a control1This practice is under the jurisdiction of ASTM Committee D24 on CarbonBlackand is the direct responsibility of Subcommittee D24.61 on Carbon BlackSampling and Statistical Analysis.Current edition approved Jan.1,2015.Published February 2015.Originallyapproved in 1986.Last previous edition approved in 2009 as D4583 95(2009).DOI:10.1520/D4583-95R15.2For referenced ASTM standards,visit the ASTM website,www.astm.org,orcontact ASTM Customer Service at serviceastm.org.For Annual Book of ASTMStandards volume information,refer to the standards Document Summary page onthe ASTM website.3Manual on Presentation of Data and Control Chart Analysis,STP 15D,ASTMInternational,1976.4Ford Motor Company Manual on“Process Capability and Continuing ProcessControl,”Publication No.80-01-251.Available in packs of five from Ford MotorCompany,Statistical Methods Publications,P.O.Box 1000,Plymouth,MI 48170.Copyright ASTM International,100 Barr Harbor Drive,PO Box C700,West Conshohocken,PA 19428-2959.United States1 chart;(2)a statistical summary of data from multiple produc-tion runs;(3)a procedure to relate the average and variation ofthese data groups to specification limits,and(4)indexes forcomparing different manufacturing units for projecting futurecapabilities or as historical reference.5.Procedure5.1 Sampling:5.1.1 In order to provide uniformity and the ability to makevalid comparisons of process capability and process perfor-mance indexes,all samples used for these calculations

此文档下载收益归作者所有

下载文档
你可能关注的文档
收起
展开